
15968
A STUDY ON FOREIGN DIRECT INVESTMENT IN INDIA
PJAEE, 17 (7) 2020
A STUDY ON FOREIGN DIRECT INVESTMENT IN INDIA
Dr. P. Sai Rani
1
and Sourav Kumar Ghosh
2
1
Head-Department of Finance, ICBM-SBE, Hyderabad
2
Student, ICBM-SBE, Hyderabad
Dr. P. Sai Rani and Sourav Kumar Ghosh: A Study on Foreign Direct Investment in India
-- Palarch’s Journal of Archaeology of Egypt/Egyptology, ISSN 1567-214x
Keywords: Indian economy, Foreign direct investment inflows, Trend
ABSTRACT
Indian economy is one of the fastest emerging economies of the world which attracts a remarkable
amount of foreign direct investments every year. However, there have been reports for the past few years
showing inconsistency in inflows of foreign direct investment in India and also the GDP of India is
observed to be in decreasing trend. This gives rise to the need of studying multiple facets of such
investments. This paper aims at studying the trends of FDI inflows in India and ascertaining the country-
wise FDI inflows and sector-wise distribution of such investments in the country. This study is based on
secondary data collected from various reliable sources. Simple statistical tools like CAGR (Compound
Annual Growth Rate), and Percentage have been used for purpose of study. The study reveals varying
trends of FDI inflows in India in the recent years which is in line with the world economy but it is
generally on a rising side. The study also reveals that Mauritius has been the top investing nation in India
and among all the sectors the service sector attracts the maximum FDI from various nations over the
period of study. The data collected for the purpose of study is limited to almost last two decades and is
entirely based on Indian economy only.
INTRODUCTION
Investment, which is also called creation of capital, is a vital determinant of a
country’s economic growth. It is required to a great extent for the economy to grow.
An appropriate level of capital together with labour, natural resources and advanced
technology can bring about optimum growth levels in the economy by way of creation
of capital goods which may be in physical, financial or human form. The other name
of this capital is investment which comprises not only domestic but also foreign
investments. Foreign investment inflows can reduce the domestic savings gap. On a
general basis, these inflows foster growth in a developing economy. Multinational
Corporation (MNC) is a proper tool to bring all the economies together on the global
platform. There is a direct proportion between the expansion of these inflows and that
of the MNCs. Backward and underdeveloped countries interested in speedy economic
development are required to import world-class machinery, technical know-how,
entrepreneurial skills, and foreign investments. Most of the world economies seeking
growth, both short-term and long-term, has to some extent depend on foreign capital
15969
A STUDY ON FOREIGN DIRECT INVESTMENT IN INDIA
PJAEE, 17 (7) 2020
inflows. It cannot be denied that this capital infusion from foreign countries contribute
to the ongoing phenomenon of economic growth, industrialization and modernization
in numerous ways.
As a matter of fact, foreign direct investment is a significant component of total
foreign investments. In such investments, the investor (an individual, a firm, a
company, etc) from a different (foreign) nation invests in a business situated in host
nation. Usually, the foreign investor acquires assets of the business or establishes
business operations to get a controlling interest in the business established in host
nation and is directly involved in its management when he invests either directly or via
other affiliates.
Furthermore, there are three components of FDI. These are: equity capital, reinvested
earnings and other capital or intracompany loans. FDI flows are recorded as a net of
capital account credits less debits between direct investors as well as their foreign
affiliates in a given financial year.
Basically, there are two routes for foreign investors to invest in India. These are:
(i) Automatic Route: On this route, no approval of authority is required by the
foreign investor. He can invest in any company without the need for
Government approval.
For example: Agriculture, Plantation, Construction Development, Industrial Parks,
Railway Infrastructure, Financial Services, Insurance, Pension Sector, etc.
(ii) Government Route: No investment can be made on this route without prior
approval of the Indian Government.
For example: Print media, Satellites-establishment and operations, Banking-public
sector, etc.
There is no uniform rate of FDI in India. This rate can be 26% or 49% or 51% or 74%.
Some industries even allow 100% FDI, that is, entire resources of these industries may
come from foreign entities. Moreover, different rates as well as routes can be observed
in a particular sector. For example: Defence and Telecom services (Automatic- up to
49% and Government- beyond 49%), etc.
There are some industries where FDI is strictly prohibited under any route. For
example: Cigars, cigarettes or any related tobacco industry, lottery, betting or
gambling businesses, Investments in chit funds, Nidhi company, Trading in
Transferable Development Rights (TDRs), etc.
In some sensitive sectors like defence, insurance and media, there have always been
conflicting views on FDI, as the integrity and security of our nation are at stake. So,
FDI caps apply for many of such industries. For example, the defence industry only
allows 49% foreign direct investment (automatic route) beyond which government
approval must be obtained.
REVIEW OF LITERATURE
Many published articles are available on foreign direct investment. A review of
relevant literature has been done. Bajpai and Dasgupta (2004) in their study
Multinational Companies and Foreign Direct Investment in China and India have
inspected the FDI patterns over the years by the MNCs into these two developing
nations and tried to find out the possibilities of attracting higher FDI inflows for India
with the framing of suitable policies. Goswamia and Saikiab (2012) in their study FDI
and its relation with exports in India, status and prospect in north-east region have
15970
A STUDY ON FOREIGN DIRECT INVESTMENT IN INDIA
PJAEE, 17 (7) 2020
explored the trends of FDI in India and determined the association between FDI and
exports during 1991 to 2011. Patil and Kadam (2014) in their research paper titled
Effects of FDI on Indian economy: A Critical Appraisal have made an attempt to
ascertain the relevance of FDI in our country by observing its inflows as well as its
effect on its economic development over the years 2000-2010. Azhar and Marimuthu
(2012) in their study An Overview of Foreign Direct Investment in India have focused
on the need, sources and determinants of FDI, its year-wise and sector-wise
examination and causes thereof. Anitha (2012) in Foreign Direct Investment and
Economic Growth in India has explained the importance of FDI for developing and
underdeveloped nations by stating that FDI plays a vital role in reducing the gap
evident between present and needed funds and resources.
NEED OF THE STUDY
There have been reports for the past few years showing inconsistency in inflows of
foreign direct investment in India. So, the need is felt to study the trends of FDI
inflows in India, identification of country-wise inflows and ascertaining their sector-
wise distribution in India.
OBJECTIVES OF THE STUDY
(i) To study the trends of FDI inflows in India.
(ii) To identify the country-wise flow of FDI into India.
(iii)To ascertain the sector-wise distribution of FDI inflows in India.
LIMITATIONS OF THE STUDY
(i) The present study is entirely based on Indian economy only.
(ii) The study is limited to only last nineteen financial years. So, the findings of this
study reflect this period only.
SCOPE OF THE STUDY
(i) To evaluate the trends of FDI inflows into India, data have been collected for the
period 2000-01 to 2018-19.
(ii) To study the country-wise flow of FDI and its sector-wise distribution in India,
data have been collected for the period 2000-01 to 2018-19.
RESEARCH METHODOLOGY
Data Collection
This study is based on secondary data. This database is constructed by pooling
information and data from various reliable sources like National Statistical Office,
Department of Industrial Policy and Promotion (DIPP), Reserve Bank of India,
statisticstimes.com amongst many other. Online database of Indian economy, articles,
journals, newspapers, etc. have also been referred.
Statistical Tool
To evaluate the trend of FDI inflows into India, CAGR (Compound Annual Growth
Rate) and percentage have been used. To study the country-wise flow of FDI and its
sector-wise distribution in India, simple calculation using Percentage has been done
for easy understanding.

15971
A STUDY ON FOREIGN DIRECT INVESTMENT IN INDIA
PJAEE, 17 (7) 2020
Data On Fdi (April, 2000 To March, 2019)
Table-I. Financial Year-Wise Fdi Inflows (Trends)
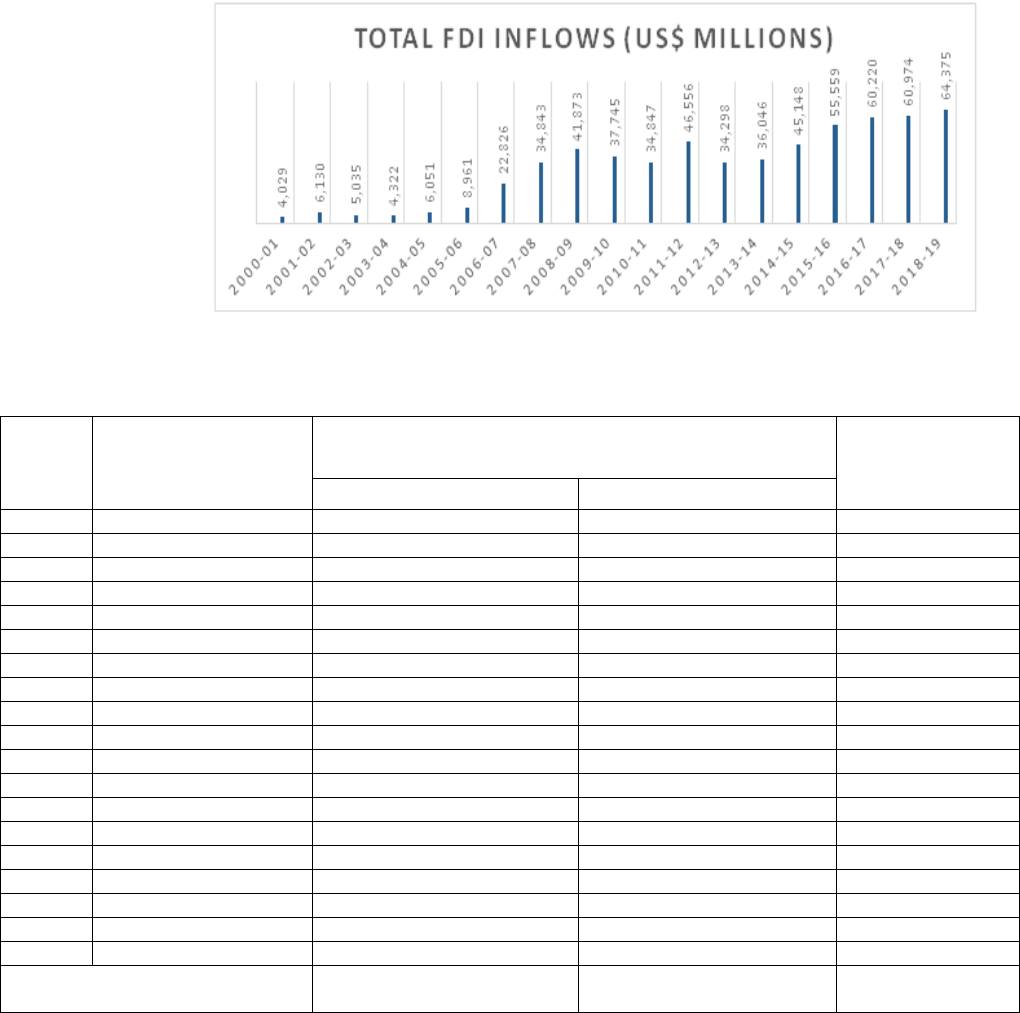
(A). TOTAL FDI INFLOWS (Equity inflows + Reinvested earnings + Other
capital) Amount: US$ in Millions
S.
No.
Financial
Years
2000-01 to
2018-
19(April-
March)
Foreign Direct Investment (FDI)
Equity
Re-invested
Earnings
Other
Capital
FDI flows into India
FIPB
Route/RBI
Automatic/
Acquisition
Route
Equity
Capital of
unincorp-
orated
bodies#
Total
FDI
Flows
Percentage
growth
over previous
year (in
terms of US$)
1.
2000-01
2,339
61
1,350
279
4,029
-
2.
2001-02
3,904
191
1,645
390
6,130
(+)52%
3.
2002-03
2,574
190
1,833
438
5,035
(-)18%
4.
2003-04
2,197
32
1,460
633
4,322
(-)14%
5.
2004-05
3,250
528
1,904
369
6,051
(+)40%
6.
2005-06
5,540
435
2,760
226
8,961
(+)48%
7.
2006-07
15,585
896
5,828
517
22,826
(+)155%
8.
2007-08
24,573
2,291
7,679
300
34,843
(+)53%
9.
2008-09
31,364
702
9,030
777
41,873
(+)20%
10.
2009-10
25,606
1,540
8,668
1,931
37,745
(-)10%
11.
2010-11
21,376
874
11,939
658
34,847
(-)08%
12.
2011-12
34,833
1,022
8,206
2,495
46,556
(+)34%
13.
2012-13
21,825
1,059
9,880
1,534
34,298
(-)26%
14.
2013-14
24,299
975
8,978
1,794
36,046
(+)5%
15.
2014-15
30,933
978
9,988
3,249
45,148
(+)25%
16.
2015-16
40,001
1,111
10,413
4,034
55,559
(+)23%
17.
2016-17
43,478
1,223
12,343
3,176
60,220
(+)8%
18.
2017-18
44,857
664
12,542
2,911
60,974
(+)1%
19.
2018-19
44,366
693
13,570
5,746
64,375
(+)6%
Cumulative Total
(from April,2000 to
March,2019)
4,22,900
15,465
140,016
31,457
609,838
-
CAGR
(+)15.7%
Source: RBI’s Bulletin March, 2019 dt.11.05.2019; (Table No.34- FOREIGN
INVESTMENT INFLOWS)
Note: All figures for financial years 2016-17 to 2018-19 are provisional.
15972
A STUDY ON FOREIGN DIRECT INVESTMENT IN INDIA
PJAEE, 17 (7) 2020
PLOTTING THE TRENDS OF FDI INFLOWS IN INDIA DURING 2000-01 TO
2018-19 ON A CHART
Chart- (a)
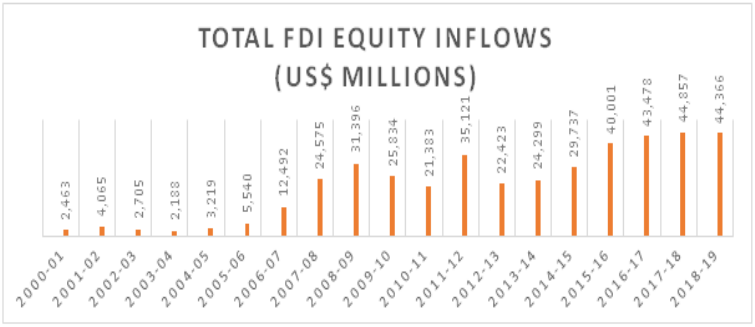
(B). TOTAL FDI EQUITY INFLOWS (excluding amount remitted through
RBI’s NRI Schemes)
S. No.
Financial Years
2000-01 To 2018-19
(April-March)
Amount of FDI Inflows
Percentage
Growth Over
Previous Year (in
terms of US $)
In Rs. Crores
In US $ Million
1.
2000-01
10,733
2,463
-
2.
2001-02
18,654
4,065
(+)65%
3.
2002-03
12,871
2,705
(-)33%
4.
2003-04
10,064
2,188
(-)19%
5.
2004-05
14,653
3,219
(+)47%
6.
2005-06
24,584
5,540
(+)72%
7.
2006-07
56,390
12,492
(+)125%
8.
2007-08
98,642
24,575
(+)97%
9.
2008-09
142,829
31,396
(+)28%
10.
2009-10
123,120
25,834
(-)18%
11.
2010-11
97,320
21,383
(-)17%
12.
2011-12
165,146
35,121
(+)64%
13.
2012-13
121,907
22,423
(-)36%
14.
2013-14
147,518
24,299
(+)8%
15.
2014-15
181,682
29,737
(+)22%
16.
2015-16
262,322
40,001
(+)35%
17.
2016-17
291,696
43,478
(+)9%
18.
2017-18
288,889
44,857
(+)3%
19.
2018-19
309,867
44,366
(-)1%
Cumulative Total (from
April,2000 to March,2019)
2,378,887
420,142
Source: dipp.nic.in
Note: All figures for financial years 2014-15 to 2018-19 are provisional subject to
reconciliation with RBI.
15973
A STUDY ON FOREIGN DIRECT INVESTMENT IN INDIA
PJAEE, 17 (7) 2020
PLOTTING THE TRENDS OF FDI EQUITY INFLOWS IN INDIA DURING
2000-01 TO 2018-19 ON A CHART
Chart- (b)
Interpretation (1)
Table I (A) and I (B) demonstrate cumulative amount of foreign direct investment
inflows in India from 2000-01 to 2018-19. Since 2000, the Indian government has
brought about vital amendments to FDI policies to ensure that the nation is
transforming into an immensely attractive destination for investing capital. The
inflows of FDI into India has increased dramatically following the 1991 reforms.
However, ever since these reforms took place, India has witnessed ups and downs in
the FDI inflows over the years, especially during the period of study, that is, 2000-01
to 2018-19. Many a times it has been evident that India has seen sudden or gradual
decrease in the percentage of FDI inflows as compared to the previous year, like
during 2001-02 to 2003-04 citing reasons like Gujrat earthquakes, pathetic attack on
World Trade Centre (now WTO) and Indian Parliament by the terrorists in the year
2001 or during 2008-09 to 2012-13 due to decline in global economy following the
2008 US Subprime Crisis and the 2012-13 Euro Crisis. Consequently, the investor
confidence declined globally.
However, India has also witnessed sudden as well as gradual surge in the percentage
of FDI inflows as compared to the previous years at multiple occasions. For instance,
during 2006-07, a sudden increase of more than 100 percent in the FDI inflows was
evident following positive amendments in in the FDI policy in 2006 whereby the FDI
procedure was made relatively simple, the capital limits were raised to 100 percent
and many restrictions were also lifted, thus resulting positive impact on civil aviation.
During 2007-08, the Indian government had organized events like Destination India
and also the DIPP (Department of Industrial Policy Promotion) website was made
user-friendly with the support of providing answers to investment-related questions to
attract more investments. After the prolonged period of line in the global economy
during 2008-09 to 2012-13, the FDI inflows in India finally recovered during 2014
due to the new government policies, initiatives like Make in India, Start Up India,
Skill India, development of smart cities and investor-friendly business environment
facilitating ease of doing business in the country. The further changes in the FDI
policy in 2017 by the government proved fruitful on eliminating several levels of
bureaucracy and making proposals for FDI to be made increasingly rational, swift and
positive under government approval route.

15974
A STUDY ON FOREIGN DIRECT INVESTMENT IN INDIA
PJAEE, 17 (7) 2020
However, India’s FDI equity inflows have declined over the last few years and has
even hit the lowest level in 2018-19 with a steep decline in foreign investments in
telecom, power and pharmaceuticals sectors. Another reason for such a decline may be
the slowing down of Indian economy in the recent past due to demonetization,
implementation of GST, job crisis, poor consumer demand, farmer crisis and NPA
burden among others. It is, however, to be noted that the new government has
alleviated 87 FDI rules across as many as 21 sectors over the past three years. For
example, it has opened up historically conservative sectors like railway and defence
for foreign direct investment.
Overall, there has been varying trends of FDI inflows in India observed in the recent
years which is in line with the world economy. On analysing the trends of FDI inflows
in India, it is generally on a rising side (particularly after 2012-13), also indicated by a
positive CAGR of FDI inflows of 15.7 percent.
Interpretation (2)
As a matter of fact, FDI comprises Equity Capital, Reinvested Earnings and Other
Capital. This other capital component further comprises amount remitted through
RBI’s NRI schemes.
Table I(A) indicates cumulative amount of FDI inflows (constituting Equity Capital,
Reinvested Earnings and Other Capital) as US$ 609,838 Million showing a positive
growth of 6% in the financial year 2018-19 over the previous financial year 2017-18.
On the contrary, Table I(B) indicates cumulative amount of FDI equity inflows
(excluding amount remitted through RBI’s NRI schemes) as US$ 420,142 Million
showing a negative growth of 1%. It implies that RBI’s NRI schemes constitute a
major part of total FDI inflows in India ignoring which the growth rate of inflows
reduced from (+)6% to (-)1%.
Table Ii. Share Of Top Investing Countries’ Fdi Equity Inflows (Financial Years):
Amount: Rupees in Crores (US$ in Millions)
Ranks
Country
Cumulative Inflows
(April,00-March,19)
Percentage of Total Inflows
(in terms of US $)
1.
Mauritius
738,156
(134,469)
32%
2.
Singapore
505,946
(82,998)
20%
3.
Japan
173,332
(30,274)
7%
4.
Netherlands
162,251
(27,352)
7%
5.
U.K.
140,370
(26,789)
6%
6.
U.S.A.
146,372
(25,556)
6%
7.
Germany
65,477
(11,708)
3%
8.
Cyprus
51,544
(9,869)
2%
9.
UAE
39,310
(6,652)
2%
10.
France
36,825
(6,643)
2%
Total FDI Inflows from All
2,378,886

15975
A STUDY ON FOREIGN DIRECT INVESTMENT IN INDIA
PJAEE, 17 (7) 2020
Countries*
(420,142)
-
Source: dipp.nic.in
*Includes inflows under NRI Schemes of RBI.
Note:
(i) Percentage worked out in terms of US$ & FDI inflows received through
FIPB/SIA+ RBI’s Automatic Route + acquisition of existing shares only.
(ii) Figures are provisional.
Interpretation
From the above table it can be observed that among the top ten countries investing in
India over the last 19 years, Mauritius and Singapore stands first and second
respectively, contributing around 52 percent of the total FDI inflows during this
period.
Table Iii. Sectors Attracting Highest Fdi Equiiy Inflows:
Amount: Rupees in Crores (US$ in Millions)
Ranks
Sector
Cumulative Inflows
(April,00-March,19)
Percentage of Total Inflows
(in terms of US $)
1.
Service Sector
416,301
(74,149)
18%
2.
Computer Hardware &
Software
221,756
(37,238)
9%
3.
Telecommunication
188,249
(32,826)
8%
4.
Construction Development
(Township)
119,614
(25,046)
6%
5.
Trading
143,599
(23,021)
5%
6.
Automobile Industry
123,989
(21,387)
5%
7.
Chemicals (Other than
Fertilizers)
91,062
(16,582)
4%
8.
Drugs and Pharmaceuticals
84,165
(15,983)
4%
9.
Construction
(Infra- structure) Activities
93,873
(14,805)
4%
10.
Power
77,889
(14,316)
3%
Total FDI Inflows from All Countries*
2,378,886
(420,142)
-
Source: dipp.nic.in
Note: Figures are provisional.
Interpretation
Among the top ten sectors attracting the most FDI inflows, it is observed that the
service sector of our country received the maximum investments constituting almost
18 percent of the total investments from these countries over the last 19 years,
followed by Computer Hardware & Software and Telecommunication sectors with 9%
and 8% respectively. It is because of the fact that among all the sectors the service
sector has been the fastest growing sector of Indian economy over a longer period of
time. The contribution of various components of this service sector like trade,

15976
A STUDY ON FOREIGN DIRECT INVESTMENT IN INDIA
PJAEE, 17 (7) 2020
financing, hotels, insurance, transport and communication, real estate and business
services, social and personal services exceed 60 percent of India’s GDP.
FINDINGS
Findings Pertaining To Objective 1
(i) There has been varying trends of FDI inflows in India observed in the recent years
which is in line with the world economy. On analysing the same, it is generally on a
rising side (particularly after 2012-13), also indicated by a positive CAGR of FDI
inflows of 15.7 percent.
(ii) There has been a remarkable growth in FDI inflows during 2013 to 2016 after a
sharp fall in 2012-13. As a result, India managed to attract good amount of FDI during
this period. However, India’s FDI equity inflows have declined over the last few years
and has even hit the lowest level in 2018-19 with a steep fall in foreign investments in
telecom, power and pharmaceuticals sectors.
Findings Pertaining To Objective 2
Mauritius and Singapore were found to be the top two countries investing directly in
India constituting around 52 percent of the total FDI inflows among the top ten
countries investing in India over the last 19 years.
Findings Pertaining To Objective 3
Among the top ten sectors attracting the most FDI inflows, the service sector stands
first with 18 percent of the total inflows over the last 19 years followed by Computer
Hardware & Software and Telecommunication sectors with 9 percent and 8 percent
respectively.
CONCLUSION
Trends are just relative numbers which might differ from that of the original numbers.
It only shows the relation in the form of percentage growth over last year whereas the
foreign direct investment keeps on coming into the economy. There can be many
factors responsible for such variations in the trends of foreign direct investment
inflows like economic, institutional and political factors. These factors include
economic growth of the country, market size, resource location, return on investment,
inflation, government regulation, political stability, tax policies and foreign exchange
rate among others.
RECOMMENDATIONS
According to previous studies by other researchers, India has been able to attract huge
amount of FDI only in the post-reform period, that is, since July 1991. However, it
cannot be denied that it is still lagging behind many other developing nations based on
the quantum of FDI inflows in respect of its size. Hence, it is recommended to shift
the focus more to the long-term development of the country rather than its short-term
growth. In the context of FDI, the government is suggested to further liberalise the
foreign direct investment policies and make India more investment-friendly. It cannot
keep relying upon a handful number of nations; rather it should look for multiple
opportunities. At the same time, it can look for possible sectors where foreign
investors can enter through automatic route and formulate policies favourable for
investments in other sectors alongside service sector.
BIBLIOGRAPHY
1. Anitha, R. (2012). Foreign Direct Investment and Economic Growth in
India. International Journal of Marketing, Financial Services & Management
Research, 1(8).

15977
A STUDY ON FOREIGN DIRECT INVESTMENT IN INDIA
PJAEE, 17 (7) 2020
2. Azhar, S. and Marimuthu, K. (2012). An Overview of Foreign Direct Investment
in India. EXCEL International Journal of Multidisciplinary Management Studies,
2.
3. Bajpai, N. and Dasgupta, N. (2004), “Multinational Companies and Foreign
Direct Investment in China and India”, Columbia Earth Institute, Columbia
University, Working Paper No. 2.
4. Goswamia, C. and Kanta Saikiab, K. (2012). FDI and its relation with exports in
India, status and prospect in north east region. Procedia - Social and Behavioral
Sciences, 37, pp.123-132.
5. Patil, D. and Kadam, S. (2014). Effects of FDI on Indian Economy: A Critical
Appraisal. Journal of Economics and Sustainable Development, 5(19).
WEBSITES REFERRED
(a) www.ibef.org
(b) www.statisticstimes.com
(c) www.coursehero.com
(d) https://witanworld.com
(e) https://taxguru.in
(f) www.nso.gov.pg
(g) https://dipp.gov.in
